

Background
TerraLab (based in Australia) and Ferrando and Associates (based in Uruguay) have worked collaboratively to innovate and introduce the STA Logger technology manual in planting tools. In mid-2022 the team at Ferrando and Associates reached out to TerraLab to discuss an idea: To utilize the STA logger hardware for mapping the planting of trees for Montes del Plata. While the device was not initially designed for that purpose, the request was an apt one. As well as being simple to use, one of the key design principles of the STA logger was to be versatile for many mapping scenarios. Mapping tree planting was always an end goal of the tool and Ferrando and Associates had recognized that utility. TerraLab then designed a prototype to suit the Pottiputki tree planting tool and was soon in a position to unveil it at ForestTech22.
What is it?
The STA logger is a device designed to automate the collection and processing of weed management data. It retrofits to existing weed control equipment and monitors its activity, before reporting back to the user through web maps. The STA logger was first released by TerraLab in 2019/20 amid the early throes of the global pandemic, but has quickly risen to be the de facto weed mapping tool for many conservation and forestry organizations globally. This technology has been co-adopted for tracking tree planting operations. Operators like Ferrando and Associates are adapting this technology to bring greater analytical power to the forestry sector to improve its efficiency.
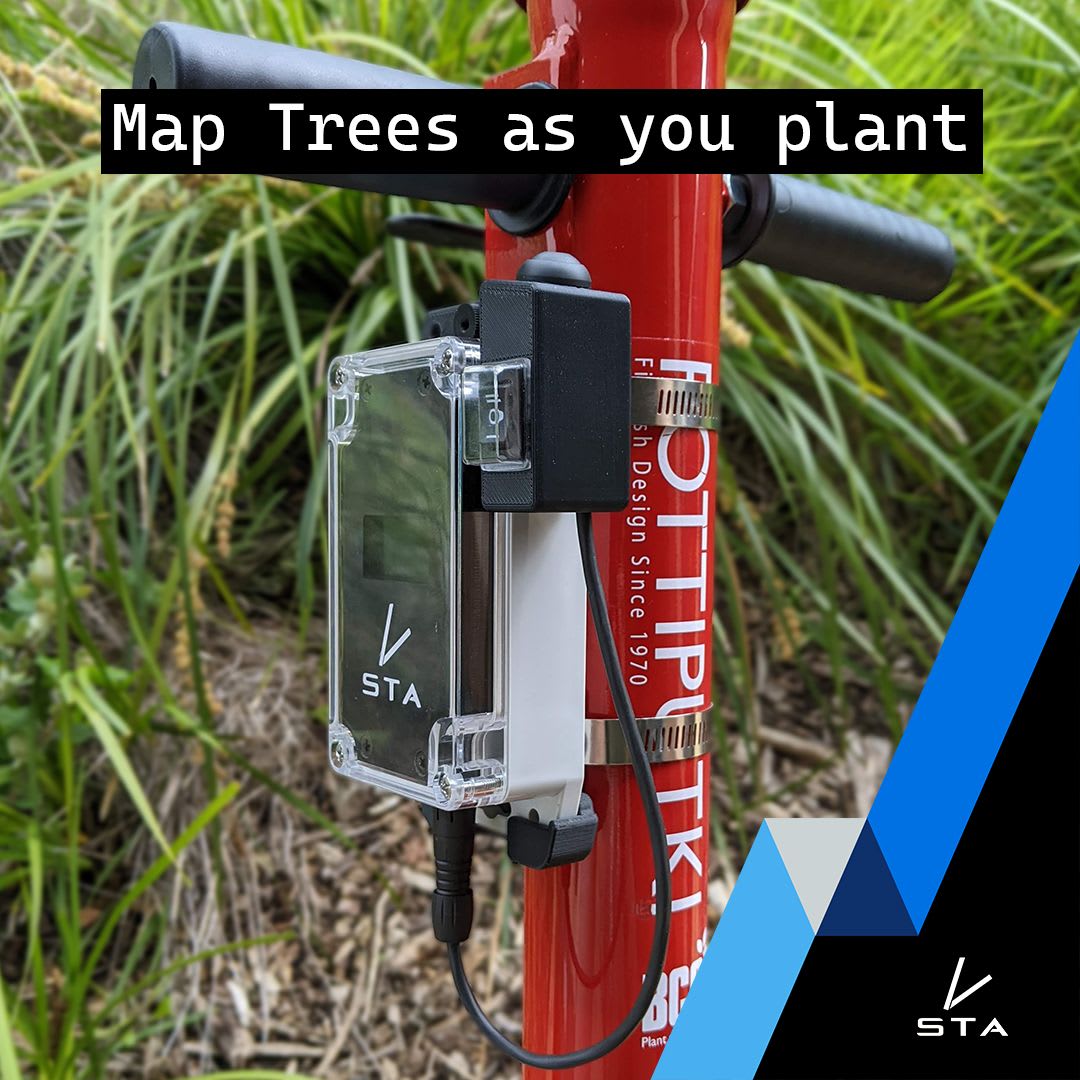
Figure 1: STA logger attached to planting tool
The planting challenge
Hartwich and Ferrando and Associates were charged with making the STA logger record tree planting events automatically, and not require user input like pressing a button. Requiring operators to register their trees being planted by pressing a button is prone to data integrity issues such as missed trees or double ups. Eventually this workflow was solved, and the STA logger was ‘triggered’ by the mechanical action of the Sarapico installing a tree. This not only avoided a potential data issue, but also simplified the use of the equipment by the field operators. In essence, nothing about their workflow had changed except they got their data at the end. The rugged and water-resistant design of the STA logger suited the forestry setting. The industry is notorious for rugged landscapes, muddy work, and challenging equipment conditions. And Uruguay is no exception.
Finding a solution that works
During the first four months of using the device for Montes del Plata, Ferrando and Associates and Montes del Plata tree planting teams recorded 28,587 tree planting events. This data was delivered directly to their web browser through a web mapping application that is universally available to project participants. The web application features some preconfigured tools such as tables, measuring tools, time filtering and map production tools which are all useful for users to report and make decisions on their project in an instant. For example, a user can zoom in, identify their project data, make a selection or filter by a particular attribute, and then export it to a spreadsheet for distribution or analysis.
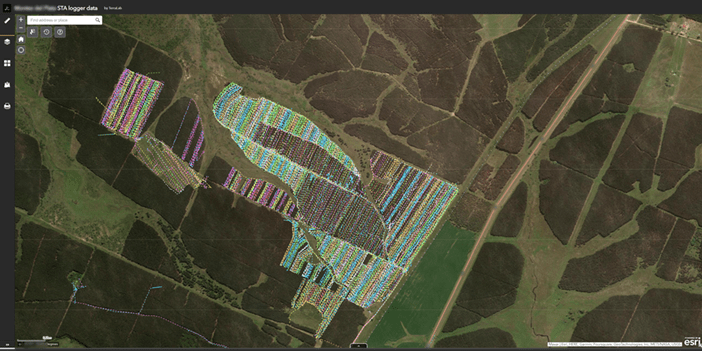
Figure 2:The web application displaying the STA logger data
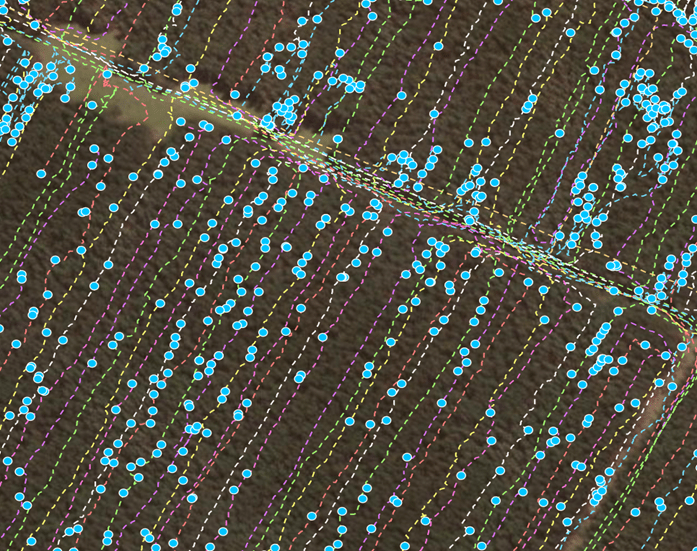
Figure 3: A view of the data where the dashed lines show the foresters walking each planting row searching for missing trees. The colors of the dashed lines represent each STA logger device. The slight wiggle in the dashed line is related to the accuracy of the GPS which averaged 0.85 m during testing. The blue dots show where a tree was installed
Because the STA logger data is hosted in the cloud, it can be integrated into a desktop GIS application in an instant; no data download required. Simply add the data via URL to your project and you have all of the analytical tools of a modern GIS application at your fingertips. Not to mention, the ability to overlay the data with your organizations authoritative layers. And when more data is collected from the field, it will update your map frame automatically. This makes it perfect for pre-formatted templates and map series, as well as analytical workflows that need to be repeated as new data is made available.
Montes del Plata are using the STA logger system for conducting planting replacements (blanking). Once the plants are placed, Ferrando and Associates analysts can query the date and time of installation, the operator, and are using the geolocation to associate the tree to soil data, climate data and information on the genetic stock that were used. According to Santiago “The info is very easy and friendly to visualize in GIS. You can download and perform data analysis easily using R, Python or Excel too”. While the core datasets are of great value, it is the secondary data that can be extrapolated from it that has even greater potential. For example, one may compare the devices, times and number of points and to obtain metrics on worker efficiency rates. Analysis of the tree locations can yield stand density or spacing data. The queries that can be made of the data are boundless. However, it is impossible if the data is not accurately collected first.
Using STA Logger for Tree density and Weed spraying data
Another technique highlighted by TerraLab, is the use of STA loggers during relief spraying (post planting weeding) to estimate stand density. A relief spray involves the application of herbicide and is conducted shortly after planting to knock down the weeds encroaching on the stem of the new tree. If done precisely, the location of that spray event will be recorded in the system and can be considered the location of a living tree. Any missing spray events can indicate locations where trees may not have survived. A study done by TerraLab (in forests of North America) ground-based data on tree density collected from the forest was compared to STA logger data collected during a relief spray. It found that both ground-based tree count data and STA logger data showed very similar estimates of density for the stand, suggesting that the STA logger data was a useful proxy for stand density at a very early stage in the coup's development.
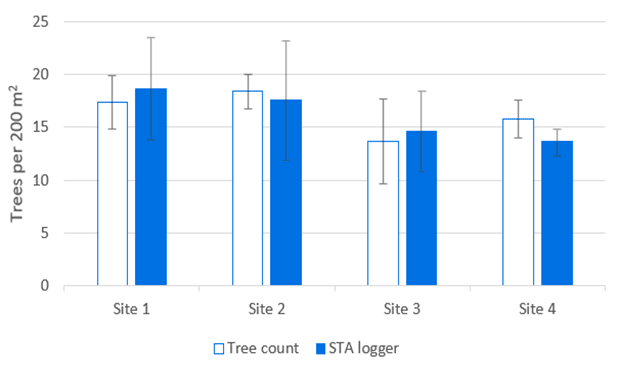
Figure 4: Comparing ground-based tree count data with STA logger data to estimate tree density at four sites in North America
Much of this data is possible to collect through remote sensing applications, but they are limited by the ability to detect small, newly installed trees. In fact, by the time a tree is large enough to be confidently detected by many remote sensing technologies, the opportunity to address any quality or stand density issues has often passed leading to production losses. This workflow provides an opportunity for early intervention without the need for additional surveys or fieldwork. STA logger has added much needed, high-resolution analytics to the field of weed control.
For more information, contact https://www.linkedin.com/in/santiagoferrando/


